Cailian Press, July 25th (Editor: Shi Zhengcheng) – Facing a murky global economic outlook, the U.S. stock index, which has hit new highs since the summer, is attracting increasing warnings from analysts that the market is entering a “frenzied bubble” zone.
At the same time, concerns about “over-trading” have made it difficult for investors to make the decision to exit, intensifying the confusion of the bubble.
Over the past few weeks, Nvidia has become the first publicly traded company in human history to reach a market value of over $4 trillion. Meanwhile, the “meme stock” hype from 2021 has resurfaced, with U.S. retail investors speculating on stocks of camera manufacturer GoPro and donut chain Krispy Kreme.
According to statistics, the price-to-sales ratio of S&P 500 component stocks has exceeded 3.3 times, setting a new historical high.
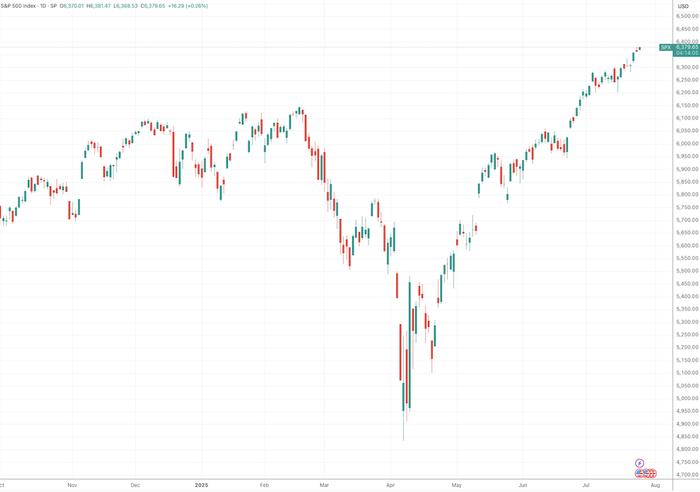
(Daily chart of the S&P 500 Index, source: TradingView)
Chief Investment Officer at asset management giant PIMCO, Dan Ivascyn, stated, “I think you’re starting to see some very early signs, similar to what happened during the internet stock boom in the late 90s to the early 2000s. There’s an element of a lottery mentality… It’s a dangerous situation.”
As a reference, Barclays’ “Stock Mania” indicator, which combines derivative flow, volatility, and market sentiment, has soared to double its normal level, entering the area related to asset bubbles.
Goldman Sachs also pointed out in a report on Friday that its “speculative trading indicator” has surged to a historic high, reaching the highest reading since the internet bubble and the pandemic period.
Goldman Sachs indicated that the speculative trading indicator has significantly increased in recent months and is currently at a level not far below that of 1998-2001 and 2020-2021. This increase is mainly driven by “the proportion of trading volume in loss-making stocks, penny stocks, and stocks with high price-to-sales ratios.”
Drawing from history, a surge in speculative trading often heralds strong returns for the S&P 500 over the next three months, six months, and twelve months, but returns over two years are below average.
In addition to hyping “fair-value stocks,” large technology stocks that have been driving the upward trend in U.S. stocks in recent years have also seen a strong rebound after their recent sell-offs. Since the mid-April low, Nvidia and Meta have risen by 100% and 49%, respectively.
Rob Arnott, founder and chairman of asset management firm Research Affiliates, stated that overall, the market valuation ratios for the S&P index, including price-to-sales, price-to-book, price-to-earnings, and price-to-dividend, are nearing historical highs. He likened investing in a small portion of these tech stocks that dominate the index to “picking up money at a steamroller.”
However, Arnott also noted that while the market prices AI companies as if they will never face any competitors in the future, it is cautious about leaving these popular and bubbled stocks too early because investors who exit prematurely could also find themselves in trouble.
Next week will be another test time.
Based on the experience of the past few years in the United States, the core factor maintaining valuation “bubbles” cannot be separated from the overall earnings expectations of tech giants exceeding forecasts. Therefore, each quarter when they release their financial reports, becomes a critical moment for the market to be tested.
Next week is such a day—Apple, Amazon, Microsoft, and Meta, among the “seven giants,” will all release their financial reports.
Neil Wilson, a strategy analyst at SPDBA, mentioned that key themes supporting the recent record-breaking financial seasons of large tech companies include artificial intelligence spending, cloud computing demand, and digital trends. Given the concentration of these “seven giants,” these data are crucial for the entire market.